
Public input you can design from
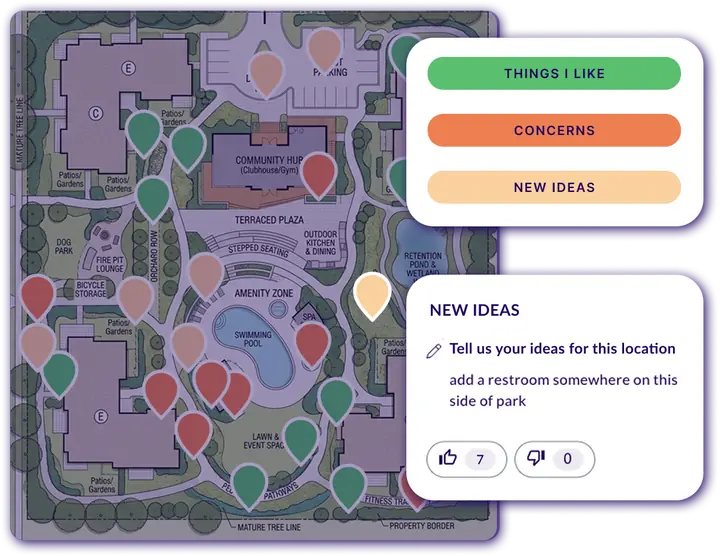
Residents drop pins, draw routes, and mark areas on your site plan. You get spatial data with the analysis already done, instead of comments to sort by hand.
Trusted by landscape architecture and planning firms across the U.S.


From your site plan to a shapefile, in one tool
The spatial structure created when you collect is what makes the analysis possible. That’s the part you can’t rebuild later in a spreadsheet.
Start from your own site plan or a blank canvas
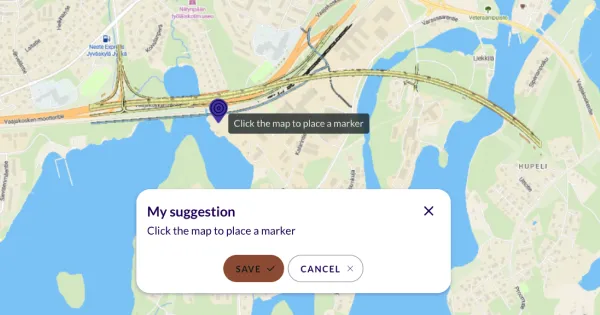
Start with a basemap of your study area, or set a rendering, illustrative plan, or campus map as the background. Restrict responses to the parcel, and set follow-up questions that fire when someone marks a spot.

Residents mark places, draw routes and areas
Points, lines, and polygons — plus geobudgeting when the project needs real tradeoffs.
Linked map and charts — not a spreadsheet export
Heatmaps across point-data questions. Tag and filter map responses. Cut the data by any response condition — income, disability status, household type. Save the view and come back to it.

Into your drawing set and your client deck
Take the responses into GIS and Illustrator, the way your team already makes maps. Shapefile, GeoJSON, and Excel with coordinates come out of one export, so nobody retypes a thing. Charts and maps save as PNG for the client deck.

Try the analysis step yourself
The map and the charts stay linked — filter one and the other follows. No signup, no download.
See how a project team runs one of these.
From a single plaza to a statewide recreation plan





LandDesign engages 10x more community members
North Wilkesboro, NC — Downtown & River District Plan. 1,900 online respondents vs. 200 in-person, from a town of 4,400.
Read story →
One survey, every region: mapping where New Mexicans recreate
New Mexico statewide SCORP. 3,280 participants across 6 regions, bilingual (EN/ES), filtered by access barriers.
Read story →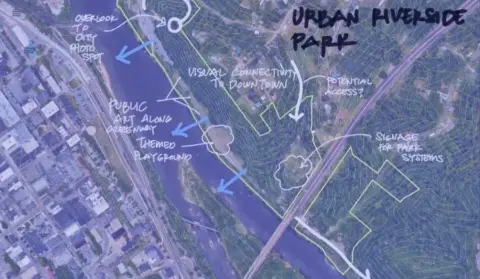
Participatory design for parks master planning
Amherst County, VA — a Virginia landscape architecture & planning firm’s “wow” example, built on pop-ups, maps, and focus groups.
Read story →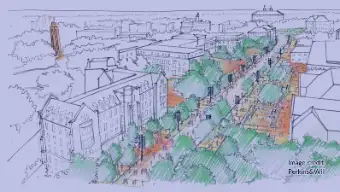
A community-driven campus master plan for the University of Kansas
Lawrence, KS — 1,600 participants through Maptionnaire, 18,000 GIS-compatible data points, and a 2024 SCUP Honor Award.
Read story →
Weighing greenway route options with the people who’d use them
Pennsylvania — senior planners at McAdams ran the Friends of the Riverfront trail routing on Maptionnaire. 500 residents reviewed route options, ranked preferences, and explained their reasoning.
Read story →The questions landscape teams ask first
Draft with a prompt, finalize with your expertise
AI writes the first version of the survey and the report. You edit both before anything reaches the client.
You hear from residents who skip the meeting
Any phone browser, multiple languages, WCAG 2.1/2.2 AA and ADA compliant.
Your data stays in the US
AWS hosting with a separate US region for US clients. Consent and privacy management come built in.
Move the sticky notes online
The table stays. Set the same map on an iPad at the open house and let people mark it where they're standing, then put it on the screen behind you so the room watches it fill in. Those marks land in the same dataset as the ones from everyone who couldn't come. Nothing waits on a pile of post-its to be typed up on Monday.
You can’t retrofit a location onto a text answer. Once a resident types “the playground needs shade” into a box, the spot they meant is gone, and no cleanup puts it back. Maptionnaire records where each response was made, so the map and the analysis have something to work from.
This is the most collaborative tool that we could integrate in our design work…. A platform like Maptionnaire allows us to gather tons of data points together and see them at-a-glance.
Mona Vijaykumar, Urban Designer — Perkins&Will
Make participation broader, faster, and more impactful.
Book a personalized demo to discover how map-based surveys can change the game of public participation and community engagement.