
.png)
For New Mexico’s Statewide Comprehensive Outdoor Recreation Plan (SCORP), 2027–2031, Anthropopulus Design & Planning needed input from residents across an entire state – urban and rural, in English and Spanish – about where they go to play outside. Maptionnaire’s map-based survey let one respondent speak to every region where they spend time outdoors, and let the team filter the results to see where people recreate and who is experiencing barriers to participation. Community input will help guide planning and investment decisions for parks, trails, recreation facilities, and outdoor access across New Mexico over the next five years.
A whole state, region by region
A Statewide Comprehensive Outdoor Recreation Plan has to speak for everyone: the trail runner in Albuquerque and the family in Lordsburg who drives over an hour to a state park. For Anthropopulus, that meant reaching residents across a large geographic area, urban and rural, who recreate in more than one part of the state.

“We were interested in capturing data about people’s recreational experiences in each region around the state.”
Maren Neldam
Community and Natural Resource Planner, Anthropopulus Design & Planning
The questions covered both the parks nearest to home and the regional destinations worth a longer drive – quality of facilities, what’s missing in each area, and where access breaks down.
The hard part wasn’t asking the questions. It was letting one person answer for every region they visit to recreate.
A resident who lives in one region but hikes in two others would either fill out the survey several times or go uncounted in the places they travel to. For a statewide plan, that’s a blind spot.
Before Maptionnaire
Before Maptionnaire, the team worked with survey tools that could route a respondent to their home region but couldn’t let one person speak to several.
“With other survey tools that aren’t map-based, we would have had two options. We could either repeat the list of questions for every region, which creates a long and cumbersome survey, or set up conditional logic, which only allows the respondent to select one region. Either way, someone who recreates across multiple regions would have had to submit multiple surveys.”
Maren Neldam
Pick your regions on the map
With Maptionnaire’s map-based tools, the team put all 6 of the state’s recreation regions on a single clickable map and let respondents choose any or all of the regions they spend time in, then provide responses about each one inside the same survey.
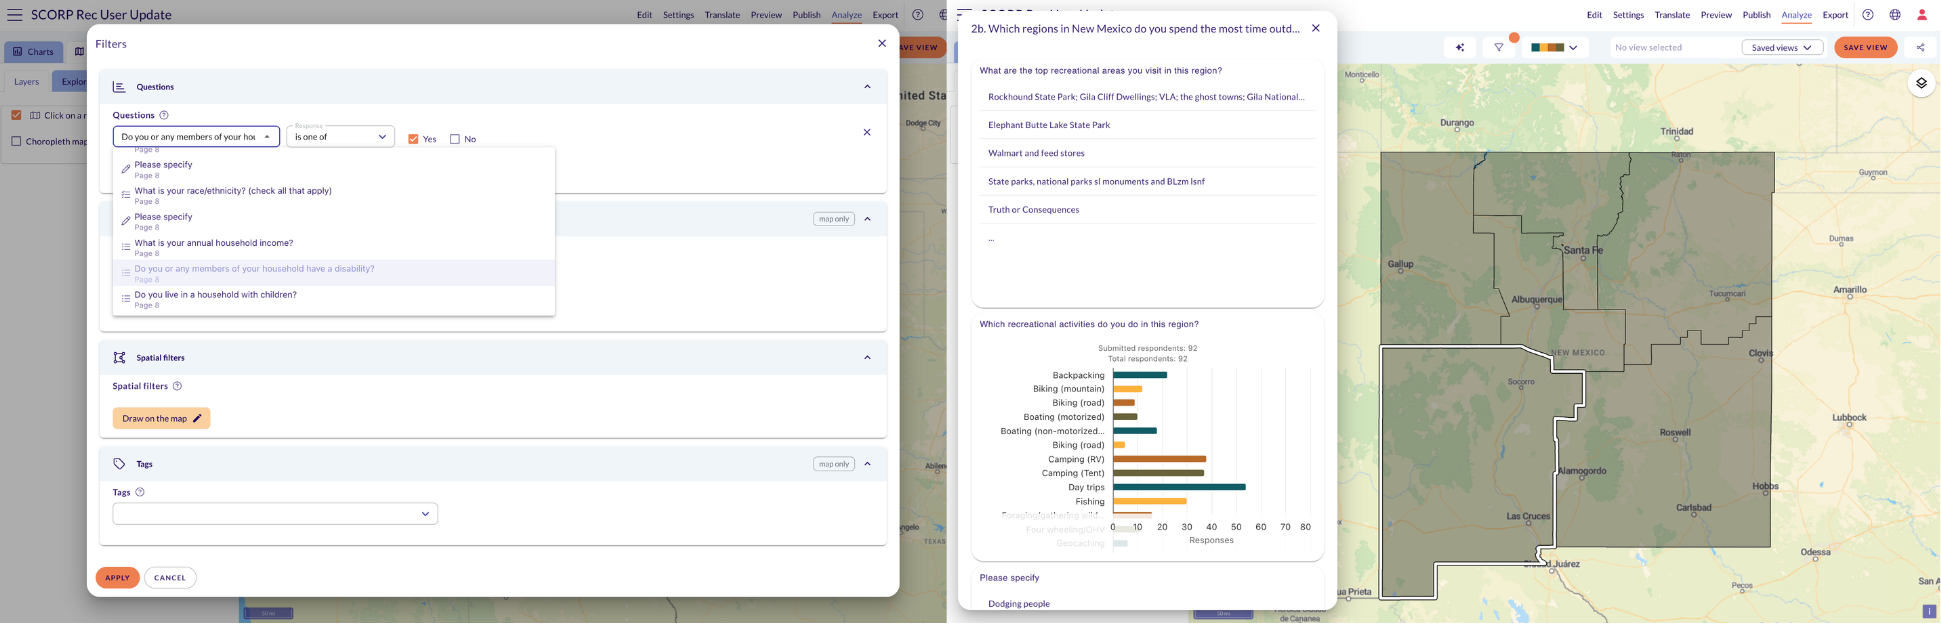
Click to see how respondents selected their regions. This is how Anthropopulus used our Pop-up Map element to figure out where New Mexicans recreate.
“We were able to use Maptionnaire’s map-based tools to provide respondents the option of selecting and responding to questions about any of the regions that they regularly recreate in...This helped us to get a better sense of whether and where people were traveling to recreate as
well as the quality of facilities and desired improvements in each region.”
Maren Neldam
So the survey recorded where people go, not just where they live: travel patterns, facility quality, and the improvements they want, region by region, from a single survey response.
3,280 participants, in two languages
The survey reached 42,455 visitors and converted 3,280 of them into participants, with responses well distributed across the regional study areas and offered in both English and Spanish, which reached communities a default English-only survey would miss.
“We had a total of 3,280 survey participants. Responses were well distributed throughout the regional study areas and participation was in both English and Spanish.”
Maren Neldam
Filtering for who gets left out
The part Maren singled out was analysis, not collection. Anthropopulus used the tool’s filtering to look at responses by social determinants like disability status and income level, and how those related to barriers to recreational access.
“We really appreciate the filtering capabilities in the analysis tool. This allows us to look at responses by a variety of social determinants such as disability status and income level and see how those relate to barriers to recreational access.”
Maren Neldam
The survey captured not just what people said, but which people said it about which places. A plan that knows where lower-income or disabled residents hit barriers to getting outside can act on it, instead of averaging everyone into one faceless result.
Anthropopulus also ran a companion survey for recreation providers who might be seeking Land & Water Conservation Fund grants to expand or improve recreational facilities in their area, pairing the public’s voice with the people who build and maintain the facilities.
Recommendations the community can stand behind
The point was a better plan. Maren’s answer was direct:
“This data allows us to make much more specific actionable recommendations in the statewide plan, which reflect community input.”
Maren Neldam
Those recommendations trace back to what residents said, region by region and group by group.
Worth the learning curve
We asked Maren what she’d tell a fellow planner weighing the tool:
“I think Maptionnaire is not as simple to use as some of the other survey tools on the market, but it provides a much better survey experience for participants. We’ve been told repeatedly that our surveys are fun to take.”
Maren Neldam
“People end up passing the surveys along to friends and colleagues because they think of it as a cool survey to share. This has helped us with promotion.”
And on the analysis side:
“The analysis tools also seem far more accurate than some of the other tools we’ve used, so it’s easier to rely on the charts and graphics generated by the platform rather than having to export the data and create our own visuals.”
Maren Neldam


.jpeg)
.webp)

.webp)


.webp)
.png)


