Building Ohio's First County Plan in 60 Years: How Envision Reached 2,000+ Lake County Residents
The community engagement tool that connects spatial data collection to live map analysis
Turn community input into defensible insights.
Draw a boundary on the map and your charts update instantly. Every finding traces back to the data, so you can defend it to clients, partners, and the public.
- 15+years in operation
- 25M+community members engaged
- 15,000+planning projects run
- 40+countries trust us
Trusted by 400+ planning organizations worldwide.



The problem
Collecting input is easy. Connecting the dots is the hard part.
There's no middle ground between eyeballing survey results in Excel and hiring a GIS analyst. Maptionnaire closes that gap: analysis lives in the same platform that collects the data.
See how our analysis worksHow we solve it
One thread from first question to final decision
This is a quick look. The full workflow is broken down step by step on the Product page.
STAGE 01 — DESIGN
Design questionnaires with spatial context built in.
- Map-based and traditional question types, response-area masking, and skip logic mean every project's data is geo-referenced from the moment it's collected. No manually adding location data after the fact. AI-generated translations put the same questionnaire in front of every language your community speaks, with no separate translation project.

STAGE 02 — COLLECT
Combine face-to-face and online input in one dataset.
- Online, mobile, kiosk, and face-to-face input all feed into one structured, geo-referenced dataset. No manual data entry, no format conversion. Respondents fill it out straight from their browser — no app, no registration — and every survey meets WCAG 2.1/2.2 AA accessibility standards without extra configuration.

STAGE 03 — ANALYZE
See what different demographics said about specific locations.
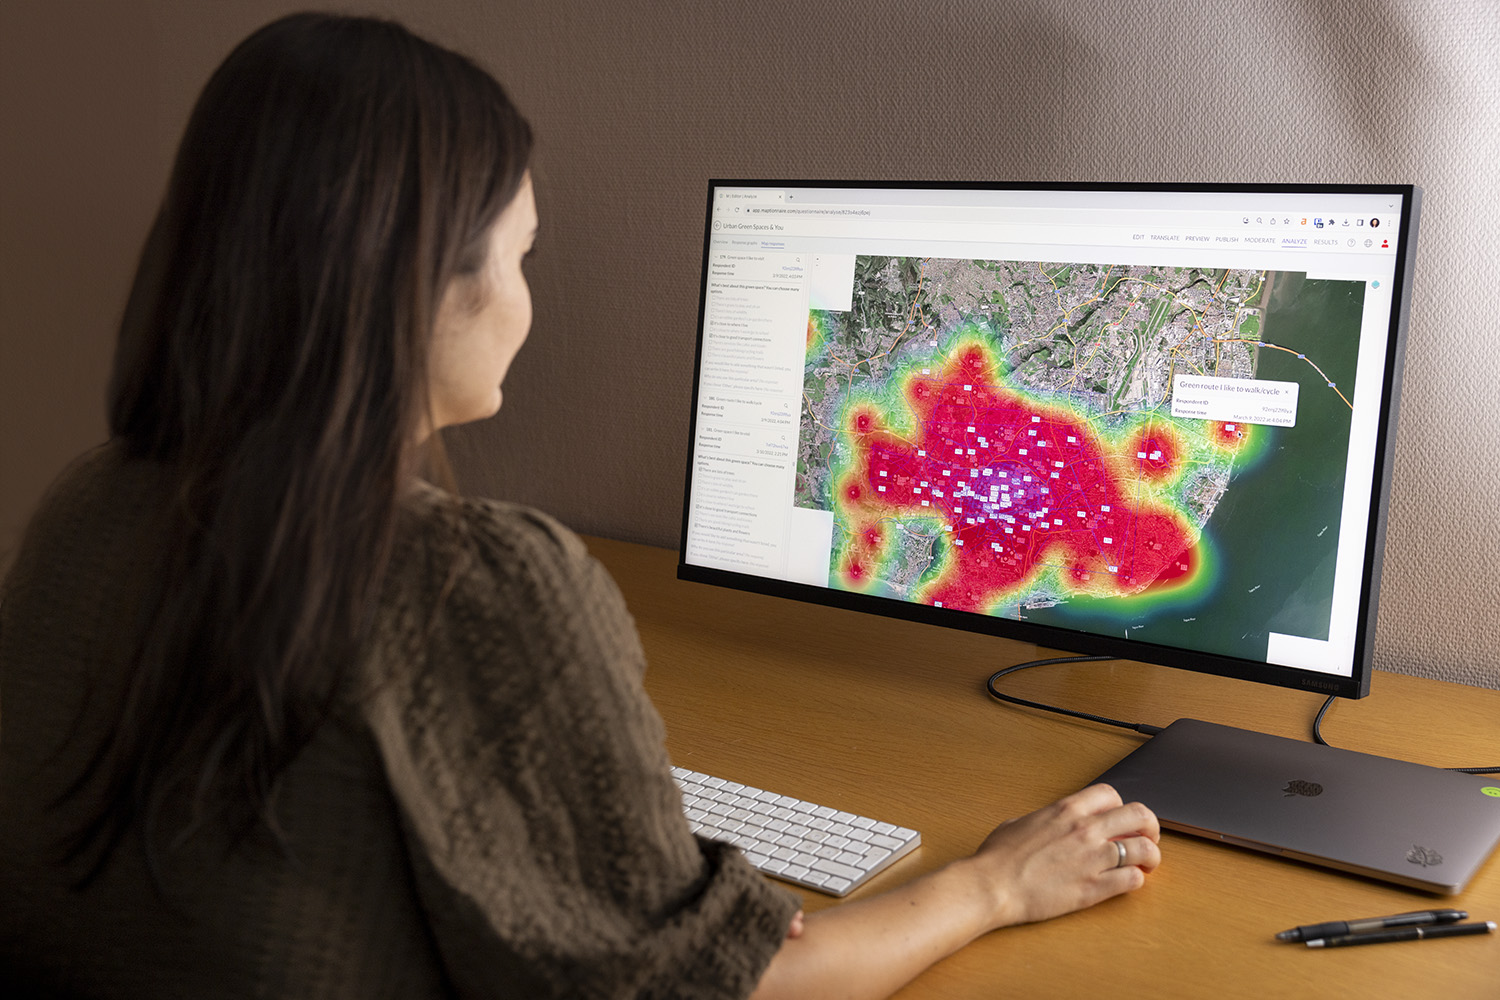
- The linked map and graph view updates in real time: filter on the map and the charts update; filter demographics and the map points update. No export, no specialist. Heatmaps surface concentration patterns at a glance, and saved analysis views let you pick up exactly where you left off.
STAGE 04 — REPORT
Share results your council & community will trust.
- Export map views, charts, and AI-surfaced themes from open-text responses straight from the analysis — or share a live, branded results dashboard instead of a static file. No screenshotting Excel charts into PowerPoint.

COMMUNICATE — BEFORE, DURING, AND AFTER
Show the public and your government clients how their input is shaping the plan.
Communicate isn't a step you reach at the end. The public project page is live for the whole project.
Before
The project page introduces the plan, the timeline, and how to take part.
During
Surveys, polls, and project updates run right on the page.
After
The finished report is published right there on the same page. The linked analysis view turns it around in minutes.

"With Maptionnaire we were able to engage a larger audience over an extended period of time, all while increasing the convenience for public input and reducing costs for the County."
Michael Gibbons

"This is the most collaborative tool that we could integrate in our design work. A platform like Maptionnaire allows us to gather tons of data points together and see them at-a-glance."
Mona Vijaykumar, Urban Designer

“An online platform like Maptionnaire can be incredibly helpful in reaching a broader, more diverse group of residents that better reflects the community in your city.”
Lizzie Friend, Community Insights Program Manager


“Maptionnaire has been so good in combining and understanding both the technical side of engagement and the people we want to have a dialogue with. We're all so happy with the platform!”
Birgitta Holmström, the City of Stockholm


What makes this different
Spatial data by design — not by export.
Most engagement tools have no spatial layer at all — GIS gets bolted on afterward, handed to a separate analyst, or skipped. Maptionnaire ships with the GIS setup already built in: bring your own maps and existing GIS layers in as the basemap, and connect directly to ArcGIS Online if that's already part of your workflow — all live in the same tool your respondents are answering in. Draw a response area or drop a pin, and the spatial structure and the analysis view are already there — nothing to set up afterward, nothing to export.
Stop exporting, schedule a demo callBuilt for the projects you already run
Whatever the plan, the workflow's the same.
Maptionnaire scales with the project — from a city-wide comprehensive plan down to a single neighborhood or corridor. A few examples of what planners use it for below; see the full list on the Product page.
Comprehensive & master plans
Visioning, drafting, and public review: each phase needs its own round of spatial input.
Mintier Harnish, Trinity County →Transportation planning
Existing-conditions travel patterns, route alternatives, and demographic cross-reference by user group.
Franklin Associates, I-10 corridor →Parks & recreation
Geobudgeting surfaces what residents prioritize when forced to choose against a constrained budget.
Hill Studio, Amherst County →Vision Zero / Safe Streets (SS4A)
Residents mark unsafe intersections and avoided routes; export feeds engineering and grant applications.
See Safe Streets case studies →Projects Done with Maptionnaire
.png)


A Flexible Community Engagement Platform Adds Value to Destia’s Transportation and Urban Planning Projects


Joustavalla osallisuusalustalla lisäarvoa Destian liikenteen ja kaupunkiympäristön suunnitteluhankkeisiin

.jpeg)
.webp)

.webp)
Workloads and winding roads: Mintier Harnish resourcefully gets California’s rural communities on the map


Increasing Resident Involvement in Sustainable Mobility Planning: Luxplan's Achievements with Maptionnaire
.webp)
.png)

Automatisoitu kaavakuuleminen – tylsästä byrokratiasta tehokkaampaan suunnitteluun yhdessä asukkaiden kanssa


Smart Regions Are Developed with Soft Data: Teaching Community Engagement with Maptionnaire at HAS University


Stakeholder Consultation in Gothenburg: Visualizing Its Cultural and Artistic Geography for Urban Planning


Case Espoo: Discovering the Benefits of a Participatory Budgeting Process While Solving a Planning Conflict


