Every feature, organized by what you're trying to do.
Grouped by product area — survey design & collection, analysis, reporting & communication, collaboration & integrations, and compliance. For the step-by-step project narrative, see the Product page
Designing and Implementing Community Surveys
Build the questionnaire and collect responses — spatial and standard question types, translation, accessibility, and gamified formats, all in one builder.
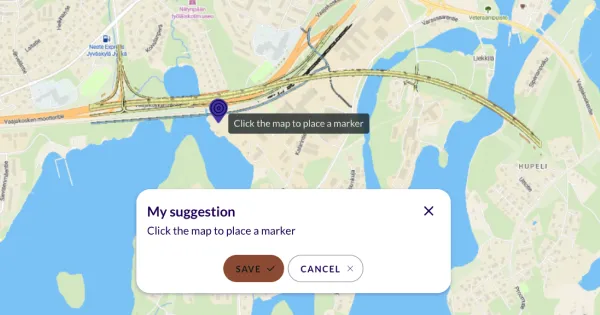
Map-based survey questions
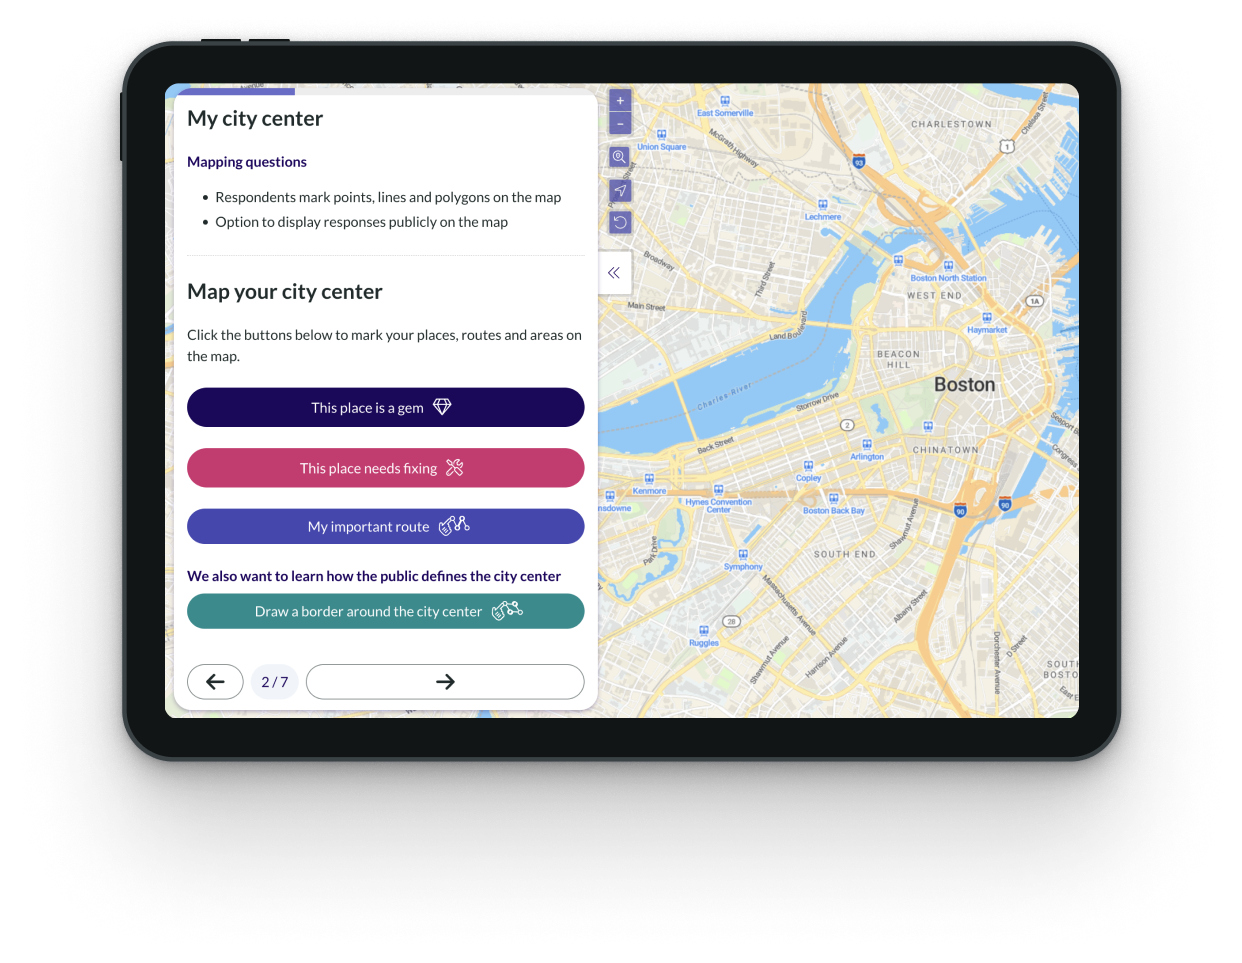
Choose from 6+ mapping question types, such as points, lines, and polygons — on a live map, or on an uploaded image (site plan, floor plan, rendering) used as the base map.
Read more ↓
Let respondents leave comments on the map by placing pins, or by drawing routes or areas.
Ask follow-up questions on what they draw (e.g. ‘What should we change here’)
Define the geographic boundaries for responses with masking layers or let respondents select from predefined map features (points, lines, areas, or grids) instead of drawing freehand.
Add clickable map pop-ups to present information and ask questions about select locations
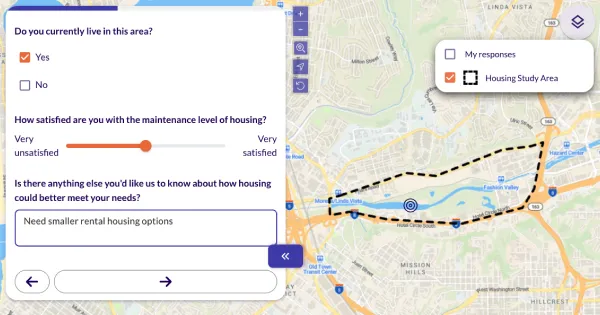
Standard survey capabilities
Choose from 9 standard question types — multiple choice, checkboxes, open text, matrix, slider, ranking and number entry — with skip logic and branching to personalize the path through the survey.
Read more ↓
Include images and videos — or ask respondents to upload their own
Combine standard questions with mapping questions for a richer data set
Ask respondents to choose between images or visualizations by incorporating them into multiple-choice/ranking questions
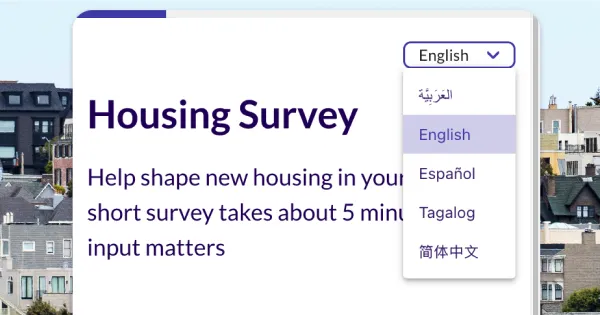
Multilingual capabilities
Translate questionnaires into any number of languages while keeping all responses in one place.
Read more ↓
60+ languages supported, including non-Latin scripts like Arabic, Chinese and Cyrillic
Automatically generates language specific URLs you can use in advertising.
AI translator can be instructed with prompts regarding e.g. tone or dialect

Accessible and low-threshold participation
Fully compliant with WCAG 2.1/2.2 AA and the Americans with Disabilities Act.
Read more ↓
Browser-based and mobile-friendly, with no download or registration needed to participate. Respondents can save and resume their survey later.

Richly interactive maps
Add clickable pop-up map elements and follow-up questions tied to specific locations for richer, place-based feedback.
Read more ↓
Let respondents select from predefined map geometries — such as parks, buildings, or bus stops — for precise feedback.
Jump respondents to different map locations based on their answers, like a zip code.
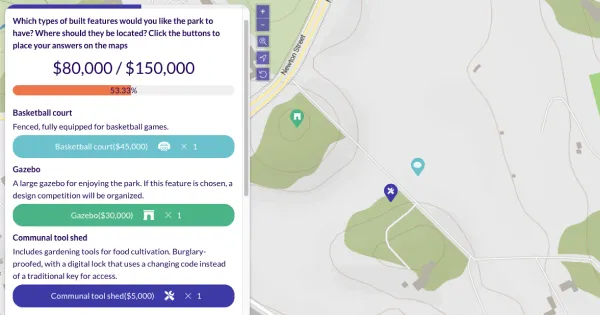
Gamified & participatory budgeting
Identify top priorities by asking respondents to make choices within a limited budget.
Read more ↓
Use "geobudgeting" (geolocated participatory budgeting) to let respondents place favorite ideas on the map within a limited budget.
Run multi-phase budgeting projects with a custom landing page, idea collection/editing, and voting.
Analysis · the differentiator
Analyzing Results
See patterns the moment data comes in — dashboards, maps, cross-tabulation, and AI-assisted analysis, without exporting to another tool.

Results dashboard
Watch charts and maps of community input update in real-time.
Read more ↓
Track participation and survey completion rates.
Customize dashboards with your favorite charts and maps. Return to them anytime or share with your team, clients, and stakeholders.

Visual mapping results
Generate heatmaps, dot maps, and maps of community-identified routes or areas.
Read more ↓
Fully-customize the data visibility, colors, and graphic look of your finished maps.

Filter, tag, and cross-tabulate
Filter and cross-tabulate results — by demographics, zip code, travel mode, etc. — to identify gaps and trends.
Read more ↓
Analyze spatial and nonspatial results together in a rich, comprehensive dataset.
Tag, color-code, categorize, and organize your data however you need.
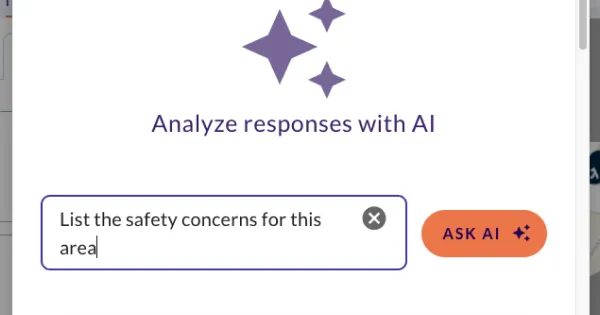
AI-powered analysis
Analyze responses with our built-in AI assistant to identify key themes, patterns, and insights.
Read more ↓
Use sentiment analysis to quickly interpret emotions in open-text responses.
Use AI features when you want, or skip them entirely. The choice is always yours.

Export for further analysis
Easily download results to analyze in other tools, such as Excel or ArcGIS.
Read more ↓
Download the original raw dataset, as well as analysis views, filters, and tags you made in Maptionnaire.
Reporting & communication
Reporting and Two-Way Communication
Report the analysis to stakeholders and keep the public informed — project pages, shareable dashboards, and public discussion, live throughout the project.

Project Page Builder
Create public-facing project pages and engagement hubs with our drag-and-drop webpage builder (CMS) — no coding needed.
Read more ↓
Embed interactive maps, surveys, community discussions, and project timelines directly on the page.
Customize the layout, branding, colors, and more. White-labelling also available.

Multilingual pages
Create translated versions of your pages in any language. Embedded surveys and sub-pages are automatically displayed in the visitor's chosen language.
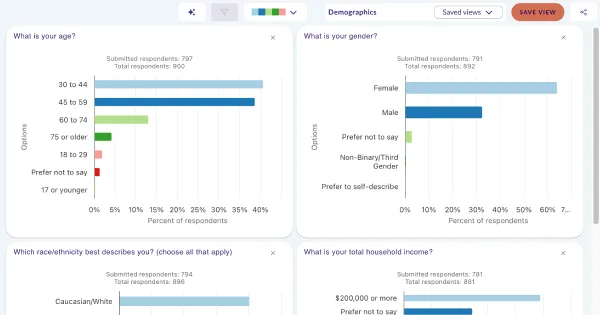
Sharable results dashboard
Share tailored views of real-time engagement results with your team, clients, or community.
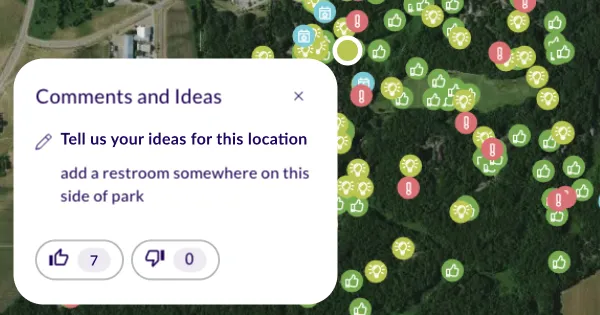
Public responses
Enable respondents to view and react to each other's map comments, for greater transparency and richer engagement.
Read more ↓
Moderate public comments by hand or with automated AI-assisted flagging.
Collaboration & integrations
Collaboration, integrations, and branding
Keep your team, your brand, and your existing GIS stack connected to the platform.
Templates & reusable elements
Create reusable templates for questions, surveys, and pages to maintain consistency and save time.
Read more ↓
Save color palettes and brand assets for on-branded visuals.
ArcGIS & other integrations
Use ArcGIS layers and styles in your surveys, and stream engagement results directly back to ArcGIS Online.
Read more ↓
Bring your own Mapbox maps and styles into questionnaires.
Connect Maptionnaire to other software via secure API integration.
Team workspace & access control
Invite unlimited team members to a secure, shared workspace — no shared logins needed.
Read more ↓
Manage and supervise team activity with role-based access control.
Download an audit report of all team activity in your workspace.
Compliance & support
Compliance and support
Everything IT, procurement, and legal will ask about — accessibility, privacy, security, ISO/IEC 27001:2022 certification, and support.
Onboarding & support
Every subscription includes an onboarding session, plus additional training options.
Read more ↓
Get responsive technical support via email or video call, with replies within 2 business days.
Accessibility
Maptionnaire is fully compliant with WCAG 2.1/2.2 AA and the Americans with Disabilities Act.
Privacy and security
Maptionnaire is fully GDPR-compliant and ISO/IEC 27001:2022 certified.
Read more ↓
We offer two-factor authentication (2FA) for your team's login, plus single sign-on: Microsoft OpenID for internal team accounts, and Google or Facebook for respondents.
Data security & hosting
Data is encrypted at rest and in transit, with regular encrypted backups.
Read more ↓
Hosted on secure cloud infrastructure (AWS), primarily in Ireland (EU region), with a separate US hosting region for US-based clients.
Data and projects are retained for 90 days after subscription expiry.