The map-based platform to design and manage community engagement
From community voices to better-built landscapes.
Trusted by landscape architecture and planning firms across the U.S.
Built for landscape projects of every kind




From public input to planning insight — in one tool
The spatial structure created when you collect is what makes the analysis possible. That’s the part you can’t rebuild later in a spreadsheet.
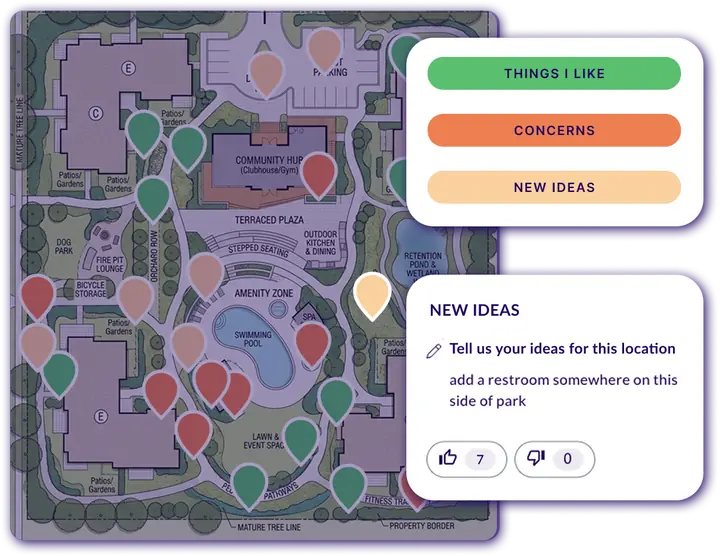
Start from your own site plan
Drop in a rendering, illustrative plan, or campus map and georeference it in-app. Restrict responses to the parcel, and set follow-up questions that fire when someone marks a spot.
Residents mark places, draw routes and areas
Points, lines, and polygons — plus geobudgeting when the project needs real tradeoffs. Browser-based, no app or registration, WCAG 2.1/2.2 AA and ADA compliant, multilingual.
Linked map and charts — not a spreadsheet export
Heatmaps across point-data questions. Tag and filter map responses. Cut the data by any response condition — income, disability status, household type. Save the view and come back to it.
Design-ready data out
Shapefile, GeoJSON, or Excel with coordinates, straight into your design workflow. Charts and maps export as PNG for the client deck.

LandDesign engages 10x more community members
North Wilkesboro, NC — Downtown & River District Plan. 1,900 online respondents vs. 200 in-person, from a town of 4,400.
Read story →
One survey, every region: mapping where New Mexicans recreate
New Mexico statewide SCORP. 3,280 participants across 6 regions, bilingual (EN/ES), filtered by access barriers.
Read story →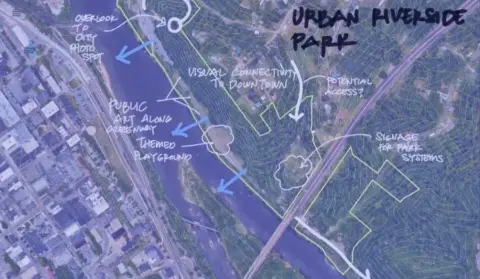
Participatory design for parks master planning
Amherst County, VA — a Virginia landscape architecture & planning firm’s “wow” example, built on pop-ups, maps, and focus groups.
Read story →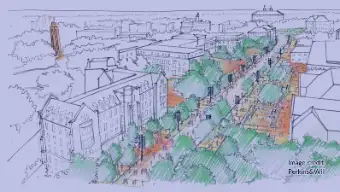
A community-driven campus master plan for the University of Kansas
Lawrence, KS — 1,600 participants through Maptionnaire, 18,000 GIS-compatible data points, and a 2024 SCUP Honor Award.
Read story →
Weighing greenway route options with the people who’d use them
Pennsylvania — senior planners at McAdams ran the Friends of the Riverfront trail routing on Maptionnaire. 500 residents reviewed route options, ranked preferences, and explained their reasoning.
Read story →No manual digitizing or GIS needed
Input automatically lands on your site plan or map.
Traceable, defensible AI tools
AI can draft surveys and reports — you’re always in control.
Mobile-friendly surveys & Project Pages
Get broader, more inclusive reach than in-person engagement alone.
Why not just export it to Excel?
Because that’s where the spatial insight gets dropped — and it’s the slowest part of the report. Most firms analyze engagement data by hand, then hand-place the findings back onto a map.
The difference isn’t a feature — it’s the data. Because responses are spatially structured the moment they’re collected, the analysis is possible at all. Cobbling together a generic survey plus a spreadsheet, or a survey plus a GIS, doesn’t get you there — that data was never spatial to begin with.
This is the most collaborative tool that we could integrate in our design work…. A platform like Maptionnaire allows us to gather tons of data points together and see them at-a-glance.
Mona Vijaykumar, Urban Designer — Perkins&Will