

For mobility and transportation planners in the US, the Safe Streets for All (SS4A) federal grant program represents a historic opportunity to eliminate roadway fatalities and serious injuries. The program’s requirement for a Safety Action Plan (SAP) places a heavy emphasis on community engagement—a task that easily leads to engagement fatigue when residents are asked to provide input they feel they have already shared.
While this program is US-specific, much of the Safe Systems approach and SS4A requirements overlap with Vision Zero or mobility planning initiatives found around the world.
Many public agencies and their consultants are now trying to move beyond superficial outreach and instead gather granular, spatial data that can be directly integrated into transportation planning and policy decisions. By leveraging the Maptionnaire Community Engagement Platform, planners can synthesize qualitative public sentiment with the quantitative data that support a Safe Systems approach.
This is because Maptionnaire uniquely captures both qualitative and quantitative feedback as spatial, GIS-compatible data. Planners can analyze and report results in-app or integrate results with ArcGIS® or other planning software.
This guide explores how engaging the community for your SAP can do more than check a box. It can create a measurable roadmap for safer streets, stronger community trust, and lasting, measurable impact.
SS4A Engagement Challenges
Many mobility planners today face a significant hurdle: planning fatigue. This occurs when residents are asked the same broad questions for years—often as part of various comprehensive or mobility plans—without seeing tangible progress or direct links to new infrastructure. When a community feels their previous input has been ignored, participation rates drop and skepticism grows. Safe Streets for All (SS4A) plans are no exception.
The goal for modern SAP engagement is to move past these repetitive cycles. Instead of starting from scratch, planners must leverage historical feedback to refine the project onhand in a proactive way. By acknowledging what has already been said over the last 5 to 20 years, you can focus new engagement efforts on the "how" of safety. This focus includes:
- Identifying specific near-miss locations and unreported collisions.
- Pinpointing physical design preferences that lead to immediate implementation.
The solution lies in using Maptionnaire to transform this community voice into a measurable, spatial dataset. By using map-based engagement, planners can turn qualitative input and community experiences into high-fidelity data that strengthens the relationship between the community and the local government.
Public input doesn't just sit in a static PDF, but lives as a proactive tool that stays valuable and actionable long after the SAP is officially adopted.
Why Standardized Engagement Data is Critical for Vision Zero Success
To move the needle on Vision Zero goals, engagement data must be as rigorous as engineering data.
A primary challenge in SS4A projects is the fragmentation of feedback—data often lives in silos, separated by the medium through which it was collected. Standardizing this input ensures that every resident's voice, whether shared online or in person, contributes to a unified spatial dataset.
The Value of Parallel Engagement
Successful SAP community engagement reaches people where they are—both online and in-person. The key is a "parallel" engagement approach: designing in-person activities that visually and functionally mirror digital mapping.
For example, using "sticky dot" exercises on large physical maps at open houses allows residents to identify danger zones exactly as they would in a Maptionnaire survey with digital map pins.
By maintaining this consistency, planners can easily merge the manually-input data with the data collected in the digital platform. This results in a single, standardized data analysis rather than a disjointed collection of notes, drawings, and spreadsheets.
Digital tools can also be used in-person to minimize manual data entry. Read about this in the Hybrid Walkshop Example, which combines an on-the-ground tour with a survey on for mobile devices.
GIS-Compatible Community Input
One of the most powerful outcomes of map-based engagement is the ability to export community feedback as shapefiles, GeoJSON files, etc. This allows planners to overlay public sentiment directly onto historical crash data in GIS systems.
Traditional "High Injury Networks" (HIN) are often reactive, based only on reported incidents. However, community input can augment these networks with "near-miss" locations and unreported collisions. For example, if 45% of your community identifies a specific intersection as dangerous, it becomes a data-driven priority even if a major crash hasn't occurred there yet.
Deep Dive: Learn more about the technical advantages of this data in our article on the Benefits of Digital Community Engagement in Transportation Planning.
Avoiding Engagement Fatigue
In any community engagement work, planners must be disciplined about the questions we ask. Community opinions on core needs rarely change significantly over a 5-to-20-year period.
Instead of contributing to planning fatigue by asking these foundational questions again, use your engagement survey or project page to communicate what has already been learned. Use existing data to refine current surveys, focusing on project-specific details and proactive improvements rather than starting from zero.
Top Questions in Safety Action Plan Surveys
Effective SS4A engagement requires moving beyond general sentiment to uncovering granular data. This means specific safety challenges and opportunities, their locations, and how opinions vary across different neighborhoods and demographics. As part of the Safe Streets for All x Maptionnaire webinar, Dr. Anna Broberg presented how real Maptionnaire-powered SS4A surveys capture this valuable data. The examples covered in the webinar were the following:
- Sonoma County Vision Zero survey prepared by MIG
- Hudson County Vision Zero survey prepared by Mercer Planning Associates
- Cedartown SS4A Action Plan survey and project page prepared by Pond & Company
- West Sacramento Comprehensive Safety Action Plan survey prepared by Nelson\Nygaard
Watch the webinar: The Safe Streets for All x Maptionnaire webinar recording (available on-demand) gives a visual walkthrough of the above example surveys and project results, presented by Dr. Anna Broberg (Maptionnaire) and Brooklyn Holton (Firm Foundations Community Consulting).
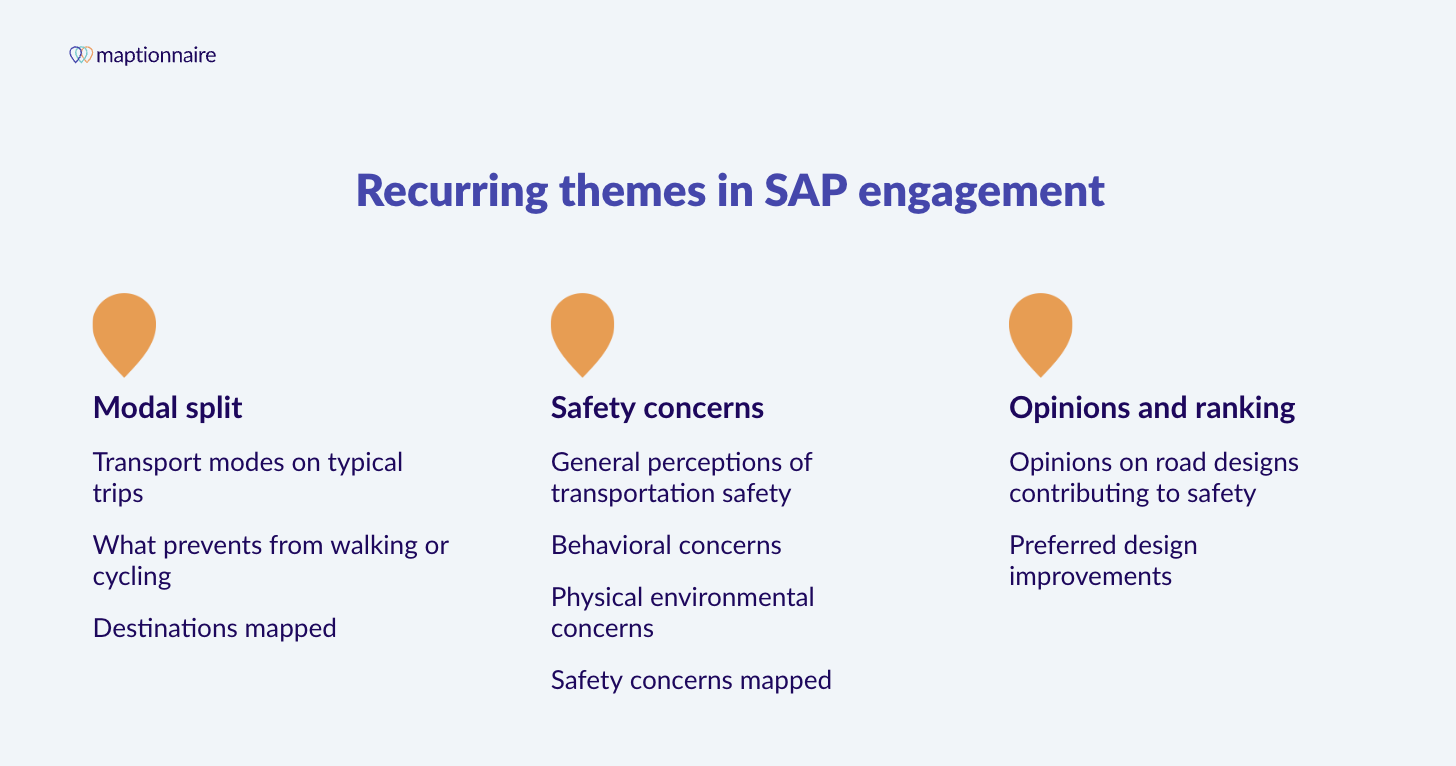
From dozens of SS4A Maptionnaire examples, including those listed above, three broader categories emerged: modal split, safety concerns, as well as opinion and rankings.
1. Modal Splits and Barriers to Active Travel
Understanding how your community moves is only the first step. A more critical question for mobility planners is: What prevents you from walking and cycling more? Identifying these barriers—whether they are physical gaps in infrastructure or perceived safety risks—is essential for designing an effective multimodal network.
For similar case studies on identifying and overcoming active travel barriers, read How St Andrews Makes Active Travel a Safe Choice and Walkability Survey in Helsinki.
2. Safety Perceptions vs. Behavioral Reality
SS4A surveys often ask residents to map destinations and pinpoint specific safety concerns, like "drivers running red lights". Community-sourced data shows to what extent public perception aligns with crash data. When matched with followup questions, they can also add valuable detail on the reasons why places feel unsafe.
3. Interactive Design and Prioritization
Instead of just asking for "input," allow residents to engage in the trade-offs inherent in planning. This can be done by asking them to rank preferred roadway designs or participate in budgeting activities. Using a "budgeting" approach—where participants allocate limited points to specific projects—turns community feedback into a prioritized list that aligns with fiscal reality.
Analyzing Community Input: AI, Filters, and GIS
Once the data is collected, the challenge shifts to analysis. For SS4A projects, which may easily generate thousands of responses, traditional manual sorting can lead to bottlenecks. Using advanced analytics allows planners to move from a "mountain of comments" to a structured roadmap for safety improvements.
Hyper-Local Insights via Spatial Filtering
One of the most powerful features of map-based engagement is the ability to filter data by location and demographic. Planners can draw a "spatial filter" around a specific high-risk intersection or school zone to see exactly who is responding and what their primary concerns are.
For instance, you might find that while the general population is concerned about speeding, residents in a specific cluster are actually more worried about drivers running red lights or poor lighting at night. This level of granularity ensures that project recommendations are tailored to the actual needs of the neighborhood.
Data in Action: See how large-scale data filtering works in practice with the Helsinki Regional Transportation Authority (HSL) Success Story, where over 30,000 residents helped shape regional mobility.
AI-Driven Summaries for Qualitative Feedback
Open-ended questions provide rich context but are notoriously difficult to analyze. By utilizing AI tools within the Maptionnaire platform, planners can quickly synthesize thousands of suggestions—such as "improve pavement markings" or "add a protected bike lane"—into coherent themes. This doesn't just save time; it ensures that every story is accounted for in the final SAP.
Seamless ArcGIS Integration
One of Maptionnaire’s standout strengths for transportation and mobility planning is its integration with the ArcGIS ecosystem, enabling planners to bring community input directly into GIS workflows without cumbersome extra steps.
- Real‑time data flow into ArcGIS: Responses and map data collected in Maptionnaire can be streamed directly into ArcGIS. This means planners don’t need to export files manually — your engagement data updates in GIS as new responses come in.
- Flexible imports and exports: Even without API keys, you can export survey outputs as GeoJSON or shapefiles and bring them into ArcGIS for deeper spatial analysis.
- Spatial analysis workflows: Once in ArcGIS, planners can use standard GIS tools to combine public feedback with planning zones, high injury networks, or demographic boundaries.
Already a Maptionnaire user? Read all about ArcGIS integration in the Help Center.
SAP Engagement Case Study: Big Results in Small-Town Leavenworth
Leavenworth, Washington (USA) is a small, rural town of under 3,000 residents that also hosts over one million annual visitors. Here's how Firm Foundations Community Consulting organized the community engagement for their SAP:
- Addressing Planning Fatigue: Instead of asking repetitive questions, the team analyzed five years of historical data to build on what the community had already shared regarding transportation and safety.
- High Participation Volume: The project generated over 1,000 comments—90% of which came from local residents—and included 815 unique locations identified in the Maptionnaire survey.
→ For another same-scale example, read about LandDesign's mobility-friendly plan for small-town North Wilkesboro, North Carolina, USA - Standardized Approach: To ensure measurable data, in-person activities were designed to "mimic" the digital survey; for example, people used physical dots on paper maps which were then manually entered into the digital system for a single data analysis.
- GIS Integration: The mapping data was pulled as a shapefile from Maptionnaire into GIS software. It was then used to augment existing crash data with unreported collisions and near-miss locations, providing a more robust safety network.
- Evergreen Reporting: The project concluded with a 30-to-40-page outreach report that serves as a tool for the jurisdiction to understand effective engagement methods for future projects.
The All-in-One Engagement Platform for Safe Streets for All
When you use Maptionnaire, you aren't just creating a map—you are creating a direct line of communication between residents and the people who design their streets. This connection ensures that when the first shovels hit the ground, the community sees their own insights reflected in the infrastructure they helped shape.
Modern mobility planning requires more than just crash and traffic data, it requires a human understanding of how people perceive and experience their local streets. Maptionnaire provides a comprehensive toolkit that empowers planners to capture and leverage this invaluable data.
Collect, analyze, visualize, and communicate community insights all in one platform. Whether you are mapping "near-miss" locations or prioritizing projects within a budget, Maptionnaire turns public input into the GIS-ready data you need for safer streets, stronger community trust, and measurable impact.
Why Planners Choose Maptionnaire:
- Unmatched GIS integration: Seamlessly integrate digital feedback into your GIS tools.
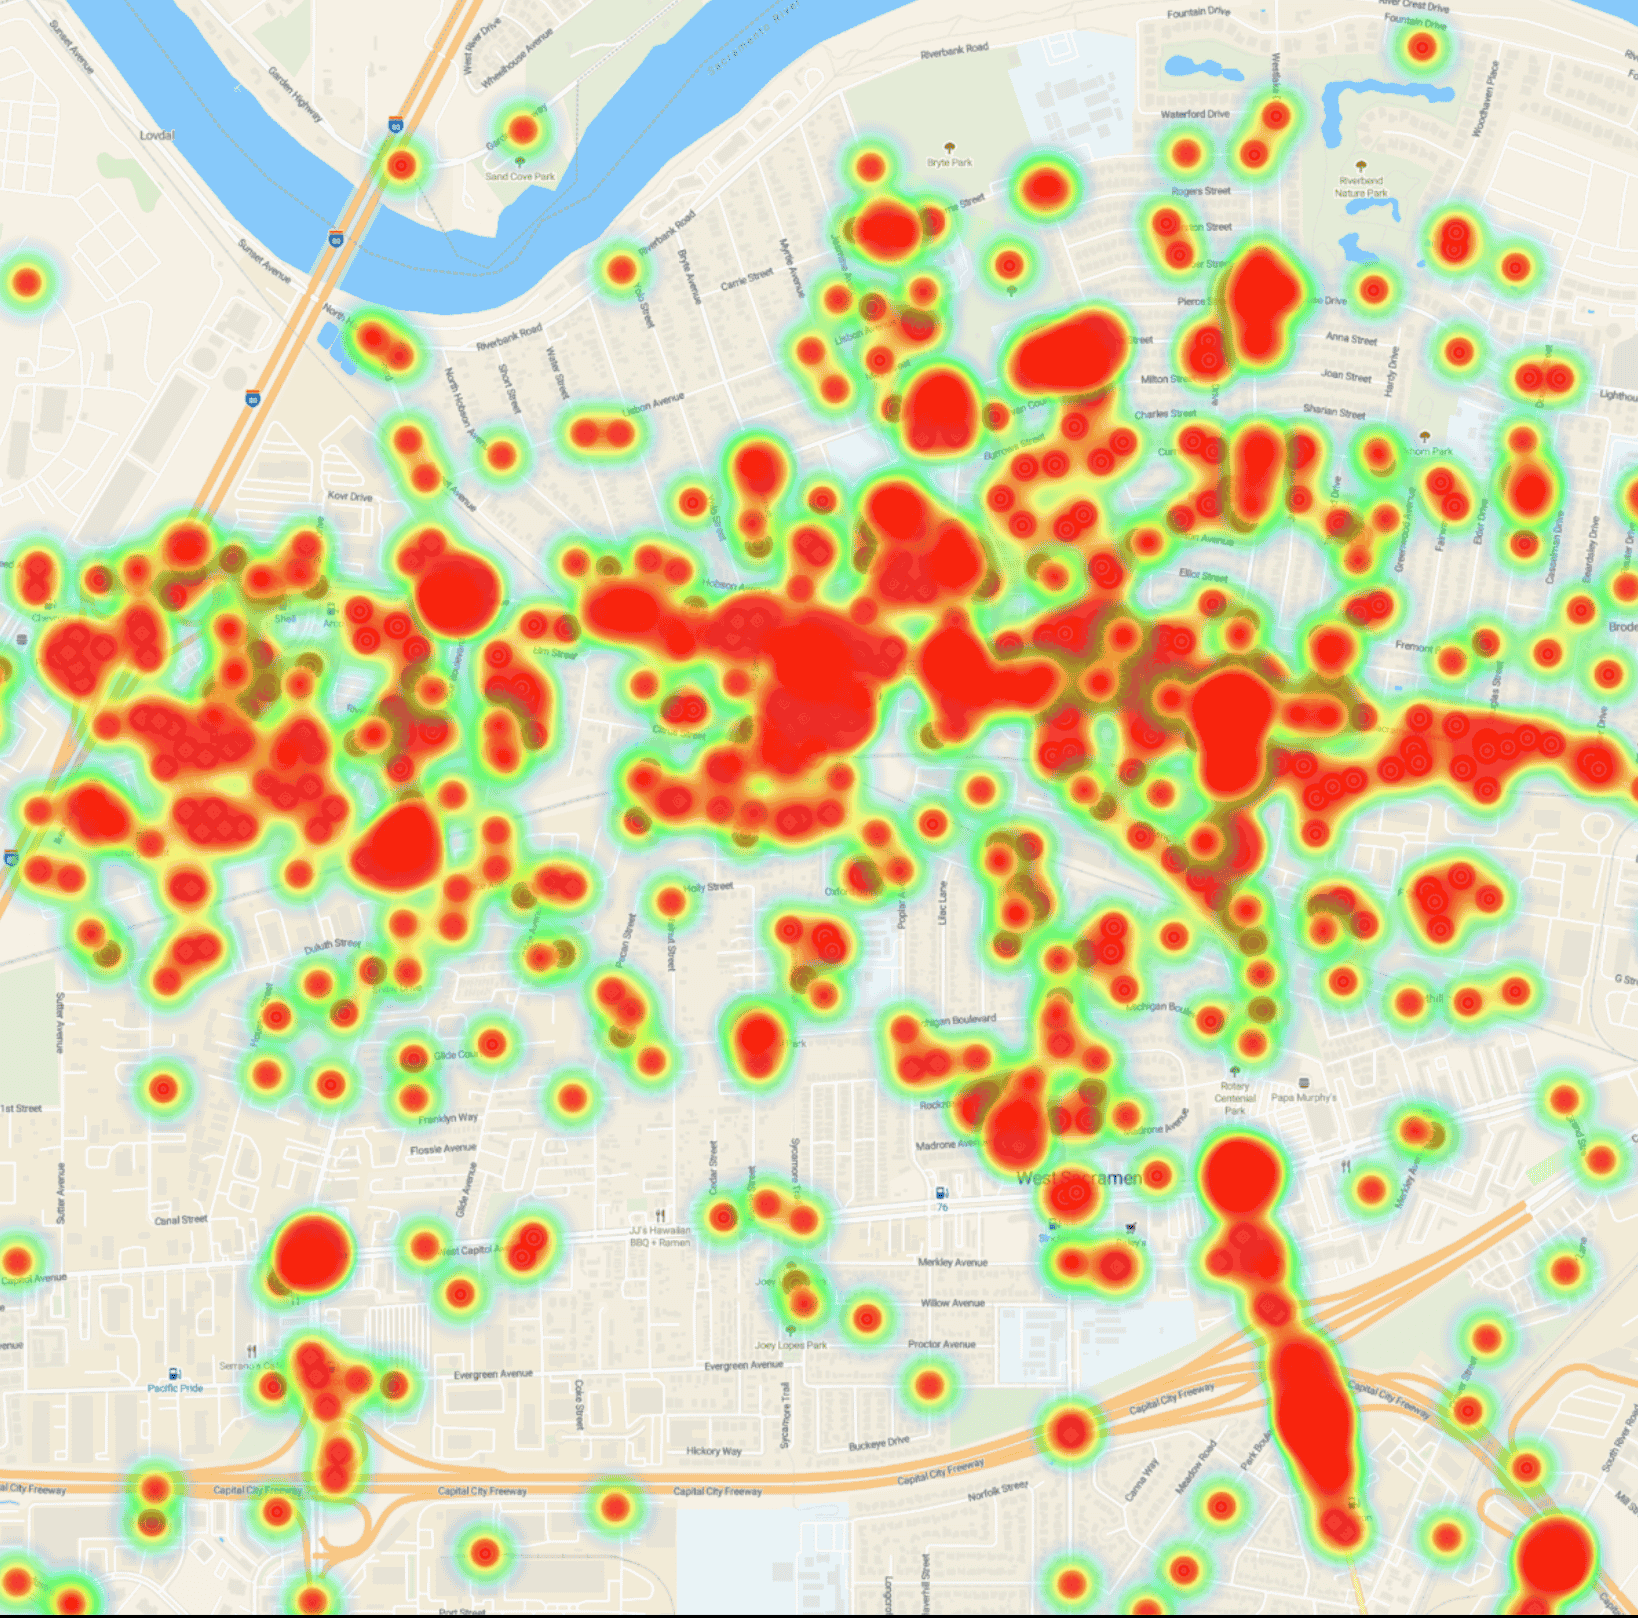
- Built-in Spatial Analytics: Heatmaps and filtering can instantly identify high-risk clusters with precision—even while data is still being collected.
- Automated Reporting: Generate and communicate robust outreach reports to colleagues, stakeholders, or the public at large.
Hear it from the Planners Themselves:
- Two US-based transportation planners emphasize the value of Maptionnaire's GIS compatibility in their mobility projects across Pennsylvania.
- Finnish transportation and urban planning firm, Destia, shares how they now use Maptionnaire for processes that once required multiple platforms.


.png)

.webp)


.webp)

-min.webp)
.webp)
.webp)


.webp)


.webp)


.webp)


.webp)
.webp)
.webp)


.webp)


