No items found.

See how our All-in-one
Community survey tool works

Discover how Maptionnaire helps planners and engagement professionals turn community knowledge into actionable insights. This interactive tour walks you through our key features — from customizable map surveys to rich reporting tools — so you can see exactly how we make participatory planning effortless.

Introduction

Public engagement deserves better than generic survey tools.

Most platforms give you questions and a spreadsheet. Maptionnaire gives you maps, spatial analysis, and a complete engagement platform built for planning professionals.

1
New questionnaire
Create a survey in seconds — the orange button is always one click away.
2
Live status badges
Live, Draft and Testing — updated in real time so your team always knows what's active.
3
Respondent count
See how many people have responded without opening the survey.
Introduction

One workspace. Every survey. Full visibility.

Your complete questionnaire library — live status badges, respondent counts, and team access all in one place. Quickly filter between active and archived surveys across all your projects.

1
Page sidebar
All survey pages in one panel — drag to reorder, click to edit.
2
Elements & Map layout
Switch between adding question elements and configuring the map for this page.
3
Add element
Drop in any question type, media block, or map element with a single click.
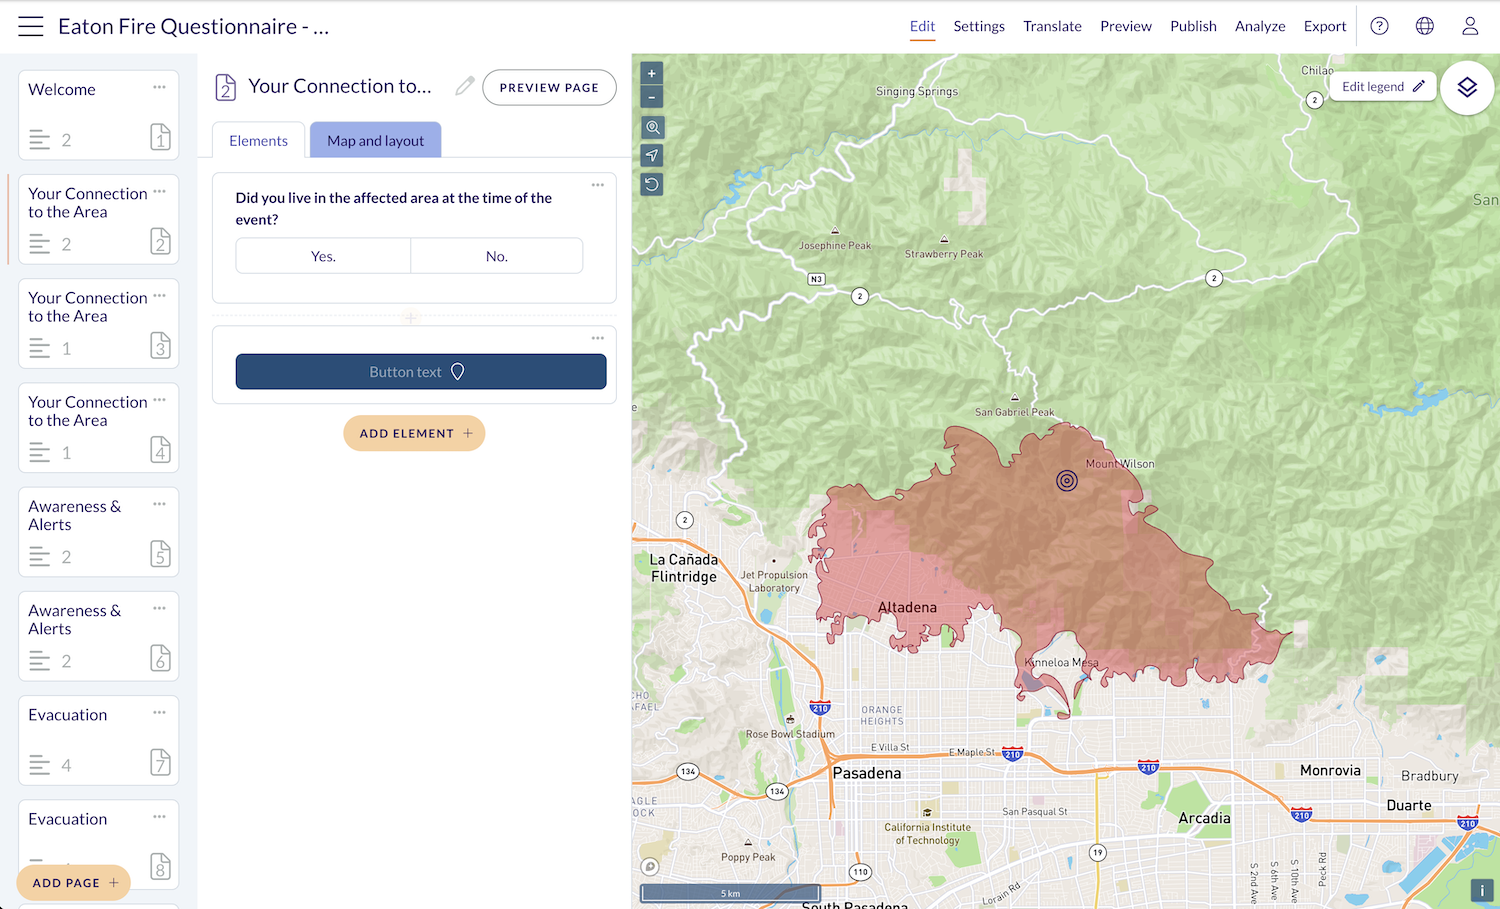
Build

Build immersive, multi-page surveys — no design skills needed.

Drag elements onto any page, add a full-bleed background image, and manage your page structure in the left sidebar. The editor shows the respondent experience as you build.

1
Question card
The question floats as a clean card — participants see context and question together.
2
Fire perimeter
GIS layers like this fire boundary render live in the editor exactly as respondents will see them.
3
Edit legend
Style the map legend labels and colours to match your project branding.
Build

Questions and a live map — on the same page.

Place questions directly alongside an interactive map. Show fire perimeters, flood zones, or planning boundaries as context while participants answer — and edit the map legend in real time.

1
Map question types
6 spatial types exclusive to Maptionnaire — let participants draw, click, or select areas on a live map.
2
Standard questions
11 familiar types — multiple choice, slider, open text, ranked choice, file upload and more.
3
Element Bank
Browse community-contributed question templates to speed up survey creation.
Build

6 map question types that no other survey tool has.

Map point, Map line, Map area, Geobudgeting, Pop-up map, Select map — plus 11 standard types like ranked choice, slider, and file upload. All in one element library.

1
Welcome card
A minimal overlay — gives context without obscuring the dramatic background imagery.
2
Social sharing
Built-in Facebook, X, and LinkedIn sharing — amplify reach without extra tools.
3
Progress indicator
Shows respondents where they are in the survey — reduces drop-off on longer forms.
Engage

Participants see a stunning, immersive experience.

A full-bleed dramatic background image, a clean welcome card, social sharing buttons, and a clear call to start. First impressions matter — this one earns trust from the first click.

1
Floating question card
Question and map share the screen — participants never lose spatial context while answering.
2
Affected area overlay
The fire perimeter is visible at all times — participants answer with the real geography in front of them.
3
Navigation
Simple back/forward navigation lets respondents review and edit previous answers.
Engage

Answer questions directly on the map.

Respondents see the fire perimeter, project area, or flood zone right alongside their question card. Spatial context makes every response more precise and meaningful.

Engage

Every page has its own visual context

Set a different background image per page — matched to the topic at hand. Here, a post-fire devastation photo gives weight and emotional resonance to questions about impact.

Configure

Control who gets in, and when.

Set open and close dates, require authentication, limit one response per device, enable bot checks, and manage embedding permissions — all from a single settings panel.

Configure

Pick a style template. See it instantly.

Choose from pre-built templates like "Minimal Blue-Orange", toggle page titles, numbering, and progress bar — with a live preview updating on the right as you go.

Configure

Smart surveys that route people to what's relevant.

Build conditional rules — SHOW, UNLESS, ONLY WHEN — to skip entire pages or individual questions based on prior answers. Powerful branching logic, zero coding required

Configure

One survey. 50+ languages.

Select any combination from Albanian to Welsh and your survey is ready to translate. Reach every resident in your community, regardless of language.

Analyze

Responses become charts the moment they arrive.

Navigate responses by page, drill into individual questions, and view auto-generated bar charts for every answer. Save custom views and share them directly with your team.

Analyze

Heatmaps show you not just what — but where.

Switch to Map responses to see where participants clicked, clustered, or evacuated to. Each map question gets its own layer — choropleth maps, heatmaps, and point data — all exportable.

Publish

Close the loop with a public project hub.

Build a branded project page — hero image, participation timeline, questionnaire link, results charts. Give participants a place to see the outcome of their input, long after the survey closes.

Publish

Publish with a link, QR code, or Word export.

Go live with a custom URL like maptionnaire.com/q/eatonfire, generate a QR code for print materials, or export a full docx report. 96 of 1000 quota slots — built to scale.

Get started

Ready to map your community's voice?

Book a personalized demo and see how Maptionnaire transforms community engagement for your organization.

Book a demo

Projects Done with Maptionnaire

Text Link
Luxembourg
Text Link
Mexico
Text Link
United States
Text Link
Switzerland
Text Link
Sweden
Text Link
Netherlands
Text Link
Mauritius
Text Link
Kosovo
Text Link
Germany
Text Link
Finland
Text Link
Estonia
Text Link
EU Project
Text Link
Denmark
Text Link
Czech Republic
Text Link
Canada
Text Link
Australia
Text Link
Digital Community Engagement
Text Link
Liikennesuunnittelu
Text Link
zoning
Text Link
Kaavakuuleminen
Text Link
Osallistuva budjetointi
Text Link
EU Project
Text Link
RUSTIK
Text Link
Guest post
Text Link
Gamification
Text Link
Podcast
Text Link
ArcticHubs
Text Link
Survey Outreach
Text Link
Tech News
Text Link
Participatory Budgeting
Text Link
Local Democracy
Text Link
Finland
Text Link
Mapita Board of Directors
Text Link
Cycling
Text Link
ISPM Conference
Text Link
Automized Public Hearing
Text Link
KasvuOpen
Text Link
Smart City
Text Link
Events
Text Link
Maankäyttö
Text Link
Nordics
Text Link
Accolades
Text Link
Documents
Text Link
Brazil
Text Link
Public Participation
Text Link
Early Participation
Text Link
Summer Meetup
Text Link
Map-Based Engagement
Text Link
Webinar
Text Link
Staff QA
Text Link
Community Engagement 2021
Text Link
Survey Tips
Text Link
Maptionnaire 10 years
Text Link
Urban Planning
Text Link
New Maptionnaire Community Engagement Platform
Text Link
Accessibillity
Text Link
Partnerships
Text Link
Children
Text Link
Research
Text Link
Transportation Planning
Text Link
Workshops

Interested in learning more about the platform?

Book a 30-min demo call with our team and we’ll show you around Maptionnaire.
Book a demo
By clicking “Accept All Cookies”, you agree to the storing of cookies on your device to enhance site navigation, analyze site usage, and assist in our marketing efforts. View our Privacy Policy for more information.