


.png)
Yes, Maptionnaire works with ArcGIS. You can bring your ArcGIS layers into a Maptionnaire survey as map backgrounds and overlays, collect public input on the same map, and take the responses back into ArcGIS Online or ArcGIS Pro as spatial data with their attributes attached, even in real time. Your spatial data stays in the tools you already use. Maptionnaire covers the step in the middle, where people draw, pin and comment on a map.
This post walks through that workflow: what goes in, what residents see, what comes out, and what to check at each step. Each part links to the help-center guide with the click-by-click instructions.
The gap between your GIS data and your engagement data
Most planning teams know the pattern. The parcels, zoning, and network layers live in ArcGIS. The comments from residents live somewhere else: in a survey tool, a spreadsheet, or a PDF. Getting the two together means exporting, reformatting, and importing by hand, and the work is repeated every time the plan changes.
Three things tend to go wrong:
- Manual export and import cycles between tools, repeated for every survey round.
- Coordinate system mismatches that shift points or break the join.
- Engagement results that cannot be joined to the GIS layers they refer to, so a comment stays a comment and never becomes a variable you can analyze.
The third one matters most for anyone who reasons from data. A comment tied to a parcel, a route, or a zone can be counted, compared, and mapped against other layers. A comment that is only text cannot. The point of connecting the tools is to keep the location and the attributes attached to every response from the moment it is collected.
Step 1: Bring your ArcGIS data into the survey
There are a few ways to display your map layers in a survey. The best way depends on the file's complexity, styling, and frequency of updates.
| Your data | Best route | Why |
|---|---|---|
| Large or detailed layers, such as zoning, or a style you have already built | Esri Vector Tile Service as a background | Tiles load in pieces and keep your styling, which matters on phones |
| Data that changes during the project | WFS (web feature service) published from ArcGIS | Maptionnaire reads the service, so you do not re-upload after each update |
| A small, fixed layer such as planned trails or park boundaries | GeoJSON or shapefile upload | Simple, and you can style by attribute inside Maptionnaire |
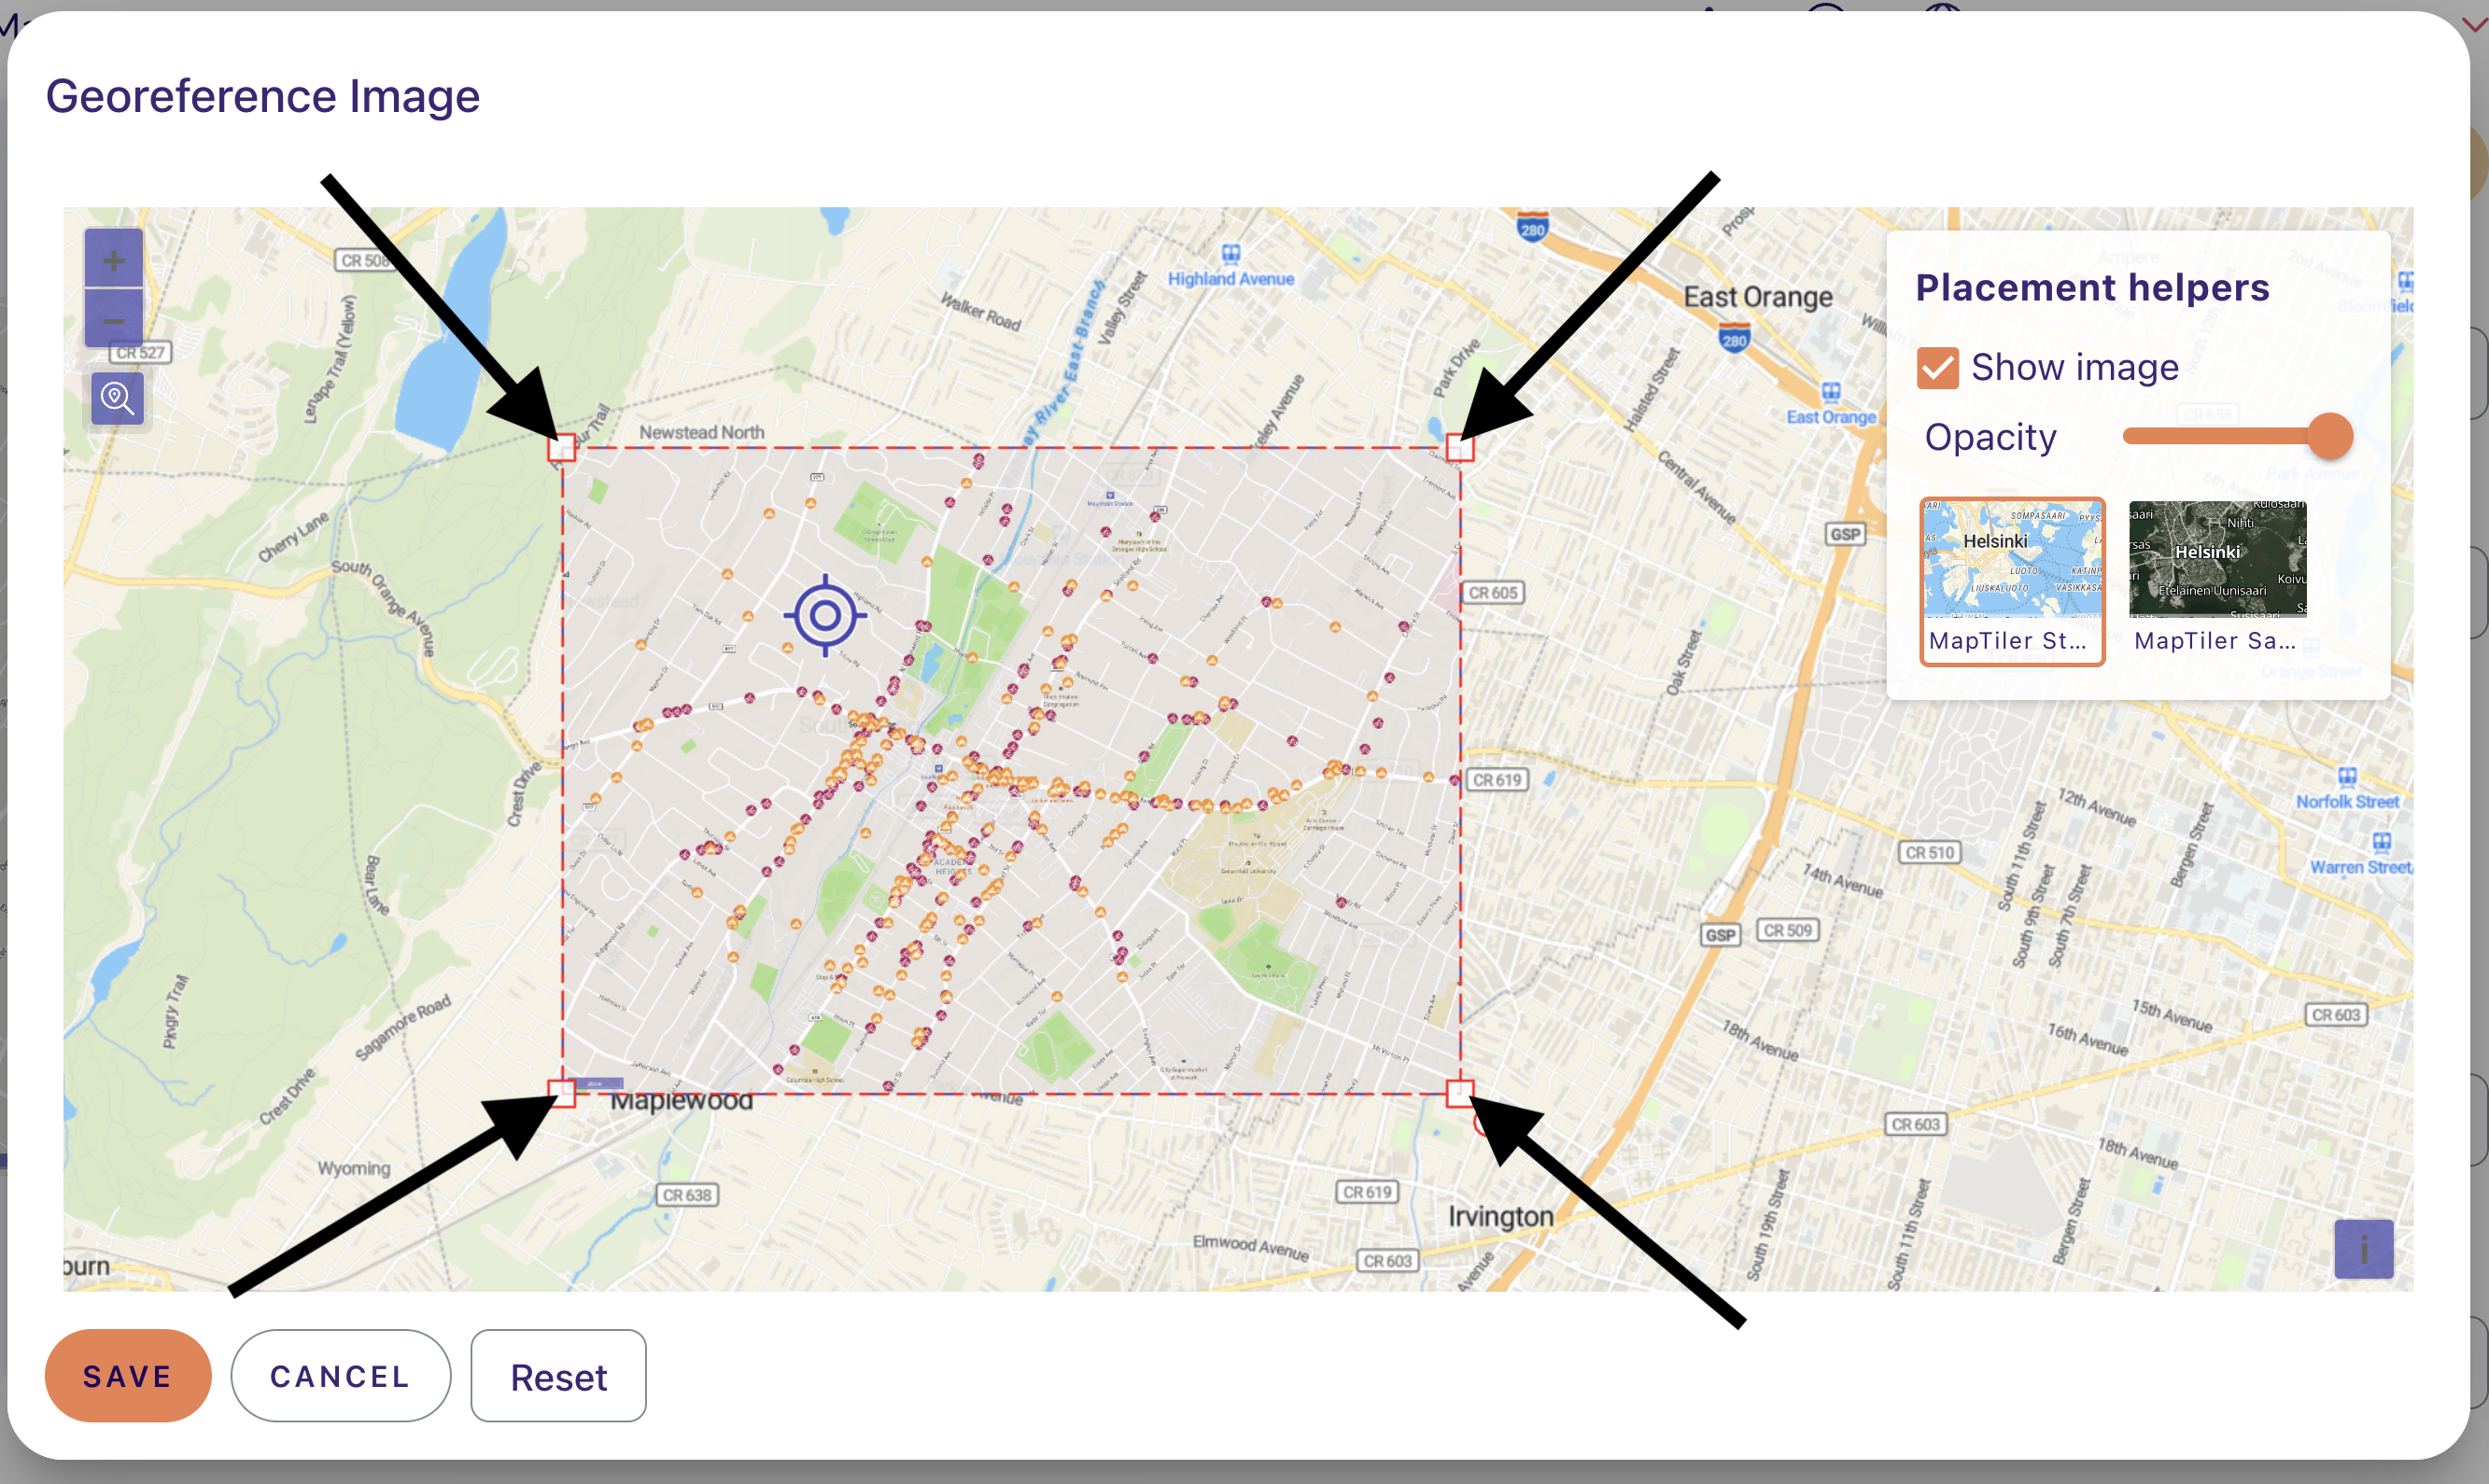
| A plan sketch or concept image | Image upload, georeferenced on the map | Residents see the concept in its place |

For vector tiles, upload a tile package built in ArcGIS Pro instead of generating the tiles while publishing, which uses ArcGIS Online credits. A WFS layer must be shared publicly, so check the sharing level before you publish.

Prepare the files before you upload. A shapefile goes in as a zipped folder that includes the projection (.prj) file, and it can use any coordinate system. A GeoJSON file must be in WGS 84. The details are in our GIS data checklist.
In a demo with the same zoning data, the vector tile service appeared almost at once. As a shapefile, it took a while to fetch the detailed features. For a survey that residents answer on a phone, that gap decides whether they finish.
If you are unsure which route to use, our support team helps with overlays and file formats.
Step 2: Collect input in a structure GIS can use
Respondents answer in a browser on any device, with nothing to install. They place points, draw lines and outline areas, and answer questions about those places. Map answers and follow-up answers are stored together, so every geometry arrives in your GIS with its attributes already attached.
A few features help when the base data comes from ArcGIS:
- Pop-up maps put your layer on the map as clickable features. Each feature can show information read from your attribute table, such as a zoning description, and ask its own questions. Give each feature a numeric ID in your data, and the same ID appears in the exported responses, so answers match back to your original features.
- Select maps let people pick from features you already identified, such as trails or buildings, instead of drawing them. The answers are cleaner and align with your layers.
- Georeferenced image overlays show a site plan or concept on top of the base map, so respondents see the proposal in its place.
Step 3: Send the results back and analyze them in ArcGIS
When responses come in, you have three ways to get them to ArcGIS:
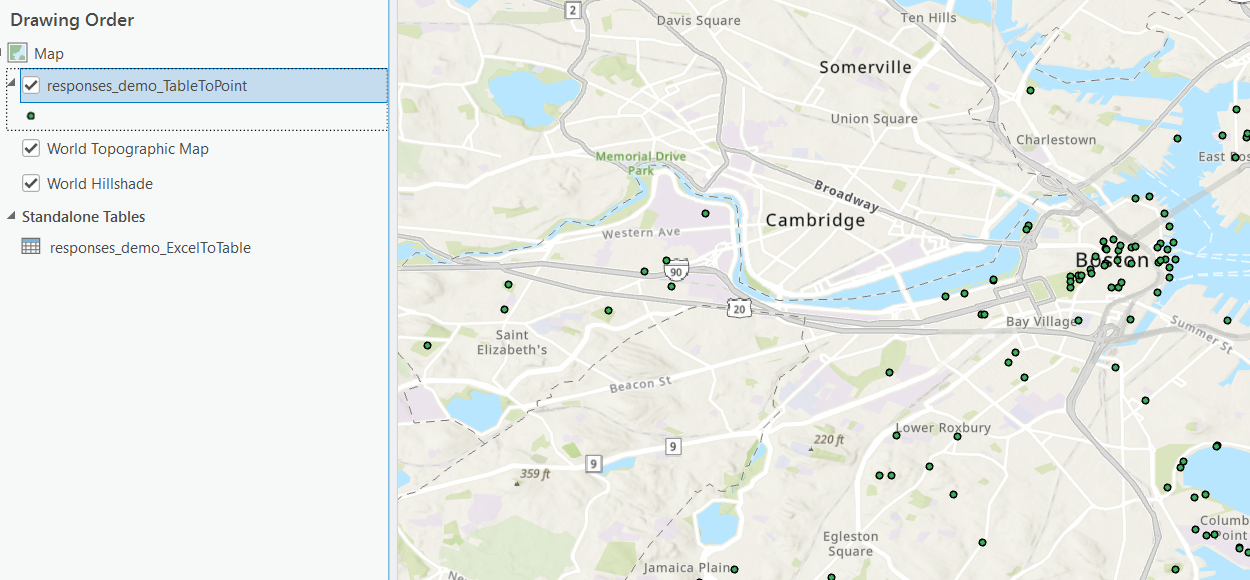
- Download a file. Export the responses as GeoJSON, shapefile or Excel and import them into ArcGIS Pro. We recommend GeoJSON: it keeps full field names (a shapefile cuts them to 10 characters), comes as one file and handles non-English characters. Each feature carries the respondent ID, the follow-up answers and the submission time, and you can include other answers such as demographics, so there is no separate join to do. The Excel file also includes coordinates. The help-center guide shows the Excel to Table route step by step.
- Use an API key. Maptionnaire can connect to ArcGIS Online through an API key, so collected data appears in ArcGIS Online as a layer. You can pull it once, for example to show results on a public map, or keep the connection live so the layer picks up new responses whenever the map is opened in ArcGIS Online.
- Analyze inside Maptionnaire first. The built-in analysis tool charts the non-map questions and cross-references them with the map answers from the first response on. Many customers stop there. Others take the cleaned subset into ArcGIS.

Coordinate systems are a common source of mismatches in this workflow. Maptionnaire accepts shapefiles in any coordinate system and GeoJSON in WGS 84, and exports come back in WGS 84 (latitude and longitude). Our projecting map data guide covers how to reproject in ArcGIS Pro.
What you can do with the results in ArcGIS Pro
Once the responses are in ArcGIS Pro, the standard tools work on them. Clean the data with Select by Attributes, compare areas with Select by Location, attach responses to your own layers with a Spatial Join, and add outside tables such as census data with Join and Relate. Each step has its own help-center article, starting from importing the data.
What stays in ArcGIS
This workflow adds to an ArcGIS setup, it does not replace one. Your layers are published and hosted in ArcGIS Online. Maptionnaire reads them as vector tiles or a web feature service. Your analysis, joins and final maps are built in ArcGIS Pro. The ArcGIS skills and licenses your team already has are what turn the responses into results.
What Maptionnaire adds is the public-facing part of the process: a survey that residents can answer in a browser on any device, with maps they can read, plus the structure that makes every answer usable as GIS data afterwards. It sits alongside the ArcGIS tools your team already uses and does not replace any of them. A common split is ArcGIS for the data and Maptionnaire for the conversation with residents.
Frequently asked questions
Do I need ArcGIS to use Maptionnaire?
No, ArcGIS is optional. Maptionnaire works on its own, with global base maps and layers you draw inside the tool.
Can I use my own ArcGIS layers as the survey map?
Yes. You can add them as an Esri Vector Tile Service, a WFS service, or as GeoJSON or shapefile uploads, and you can overlay georeferenced images.
Can I get the results back into ArcGIS Pro?
Yes. Download the responses as Excel, GeoJSON, or a shapefile and import them, or connect to ArcGIS Online with an API key.
Do residents need an ArcGIS account?
No. Residents answer in a browser, with nothing to install and no login to ArcGIS.
What do the exported responses contain?
Each feature carries the respondent ID, the follow-up answers and the submission time, and you can include other answers such as demographics.
Try the workflow with your own data
If you already have a Maptionnaire subscription and ArcGIS layers for a project, the quickest test is to add one as a background in a new survey and see how it loads. Start with the Maptionnaire and ArcGIS overview in our help center.
New to Maptionnaire? Book a demo and we will set it up around your project and your data.
.png)


.png)
%20(1).png)




.png)

.webp)


.webp)

-min.webp)
.webp)
.webp)


.webp)


.webp)


.webp)


.webp)
.webp)
.webp)


.webp)


